Understanding the Data Candle
 LiquidLvy
Published on: 17/03/2026
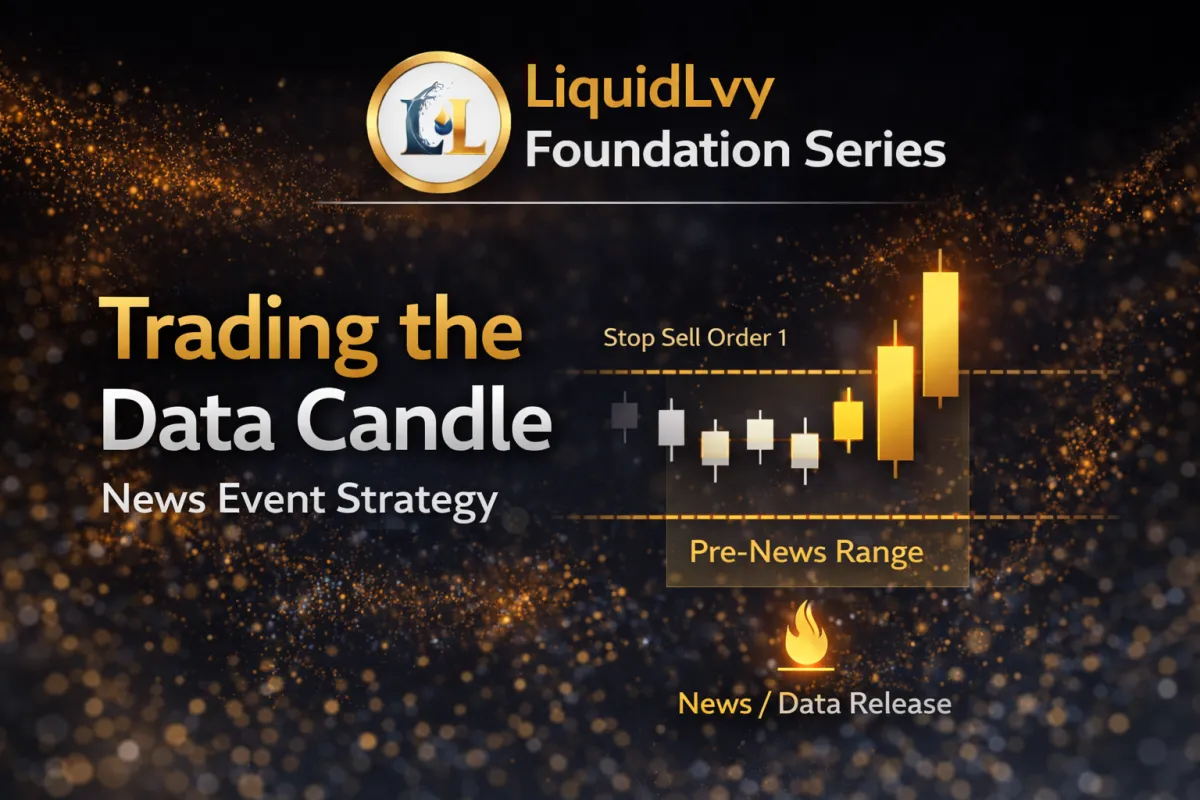
Article 6 of the LiquidLvy Foundation Series explains how traders prepare for economic news releases using data candles, range breakouts, and bracket orders to enter trades with defined risk and structured execution.
Foundation Series