Understanding the Data Candle
LiquidLvy Foundation Series — Part 6
Understanding the Data Candle
Economic news releases create some of the most volatile moments in financial markets. For traders who understand how to prepare for these events, that volatility can present structured opportunities.
In this lesson of the LiquidLvy Foundation Series, we introduce the concept of the Data Candle and explain how traders prepare for scheduled economic news events using a defined range and bracketed stop orders.
Lesson Objective
By the end of this lesson, traders should understand:
What a data candle is
How economic news creates volatility
How to structure bracket stop orders around news events
Why preparation matters more than prediction when trading scheduled economic announcements
What Is a Data Candle?
A data candle forms during major economic announcements such as:
CPI (Consumer Price Index)
PPI (Producer Price Index)
Consumer Sentiment
Jobs reports
When the news is released, price often moves rapidly in both directions before establishing a clear move. This volatility creates large candles and expanded ranges on the chart.
Understanding how to structure trades around this volatility is the purpose of the data candle setup.
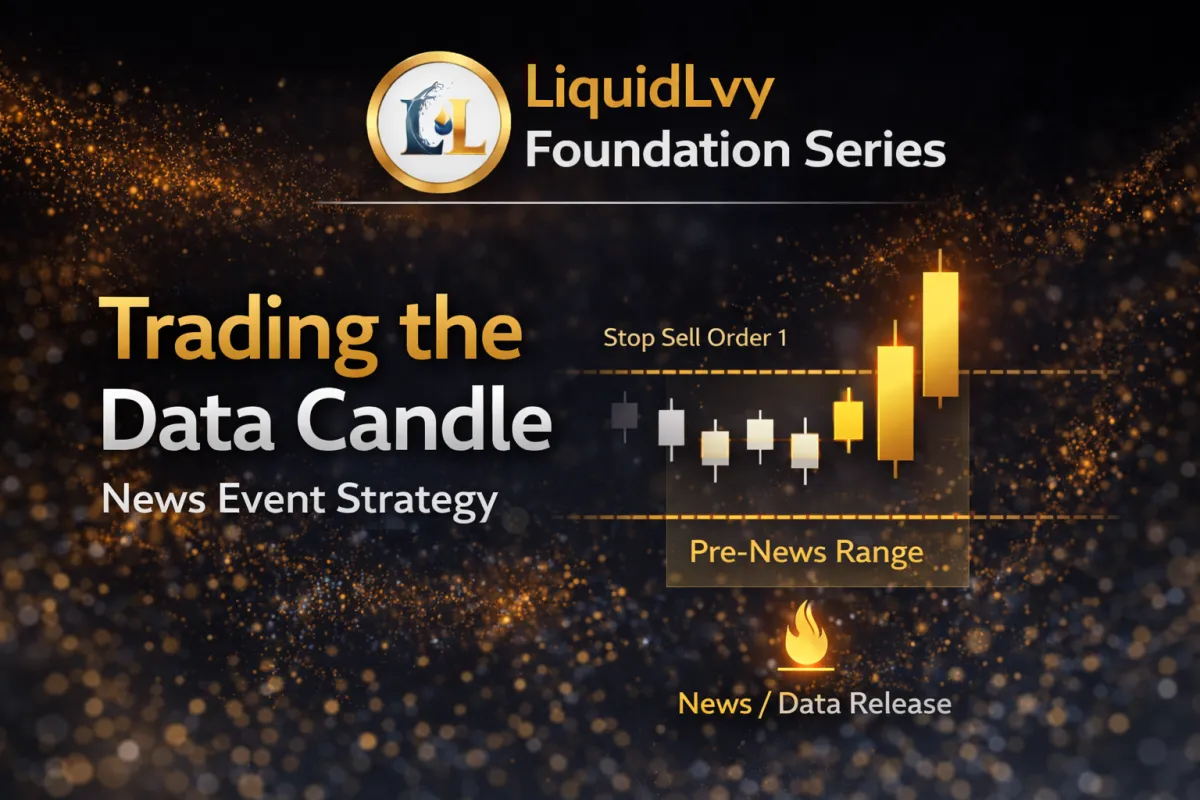
Step 1 — Identify the Pre‑News Range
Before the economic release occurs, traders observe the range price is trading within.
This range becomes the reference structure for the setup.
The top of the range represents potential buy‑side liquidity, while the bottom represents sell‑side liquidity.
Once the news is released, price frequently breaks out of this range as volatility expands.
Illustration — Data Candle Range Setup

Step 2 — Place Bracket Stop Orders
Instead of predicting direction, traders prepare for movement by placing stop orders on both sides of the range.
Typical structure:
Buy Stop Order placed above the range
Sell Stop Order placed below the range
These orders allow the market to determine the direction of the move.
The order that triggers first becomes the active trade.
Step 3 — Define the Trade Structure
Each trade uses a predefined order structure:
Entry Stop Order to enter the trade
Stop Loss to control risk
Limit Order to take profit
This bracket structure ensures that both risk and reward are defined before the trade activates.
Illustration — Bracket Order Trade Structure

Why This Setup Works
During major economic announcements, price moves quickly as liquidity enters the market.
These rapid moves can trigger clusters of stop orders above and below the range.
Once the breakout occurs, momentum often carries price toward the next liquidity target. These expansions often precede the types of high‑probability opportunities discussed in the A+ setup earlier in the LiquidLvy Foundation Series.
The bracket order structure allows traders to participate in that move without attempting to predict the direction beforehand.
Practice Before Trading Live
Because news volatility can be extreme, new traders should practice this setup in a controlled environment before risking real capital. This is typically done using:
Paper trading accounts, which simulate real market conditions without financial risk and allow traders to practice placing bracket orders, managing stops, and observing how news volatility affects price movement.
Evaluation accounts used by funded trader programs, which mirror live trading environments while still allowing traders to build discipline, execution skills, and risk management habits.
Practicing in these environments helps traders become comfortable with fast-moving conditions, understand how quickly price can expand during a data candle, and develop the discipline required to follow a structured trading plan before transitioning to live capital.
Funded trader evaluations reward disciplined execution and risk control. Practicing structured setups like the Data Candle helps traders develop the consistency required to pass these evaluations.
The A+ Setup One‑Sentence Rule
If price sweeps liquidity and then breaks market structure in the opposite direction, enter on the retracement into the Fair Value Gap and target the next pool of liquidity.
This rule summarizes the entire A+ setup used throughout the LiquidLvy Foundation Series:
Sweep Liquidity → stops are taken
Break of Structure (BOS) → confirms direction
Retrace to FVG → entry zone
Target Next Liquidity → exit objective
Illustration — A+ Setup Execution Model

The Key Idea
The goal of the data candle setup is not to predict the news outcome. Economic reports can produce sudden and unpredictable reactions as traders, institutions, and algorithms respond simultaneously to new information.
Because the immediate reaction to news can be chaotic, attempting to guess the direction of the move often leads to emotional decisions and unnecessary risk.
Instead, traders prepare for volatility and allow the market to determine direction. By identifying the range that forms before the announcement, traders establish a clear reference structure on the chart.
Once the news is released, bracket stop orders positioned above and below that range allow the trade to activate only when momentum begins to expand.
By defining the range and placing bracket stop orders, traders create a structured and disciplined approach to trading economic news events.
🧑🎓 Foundation Series
Start Here → 1
Next Lesson → 7
Full Series:
1 | 2 | 3 | 4 | 5 | 6 | 7 | 8 | 9 | 10 | 11 | 12
Video Lesson
Watch the lecture associated with this lesson:Watch the class breakdown here ↓